Targets: Overview
Targets are the final stage in the DataStream processing flow. They forward processed data to external consumers and convert from standardized pipeline output to destination-specific formats.
Provider → Device → Preprocessing → Pipeline → Postprocessing → Target → Consumer
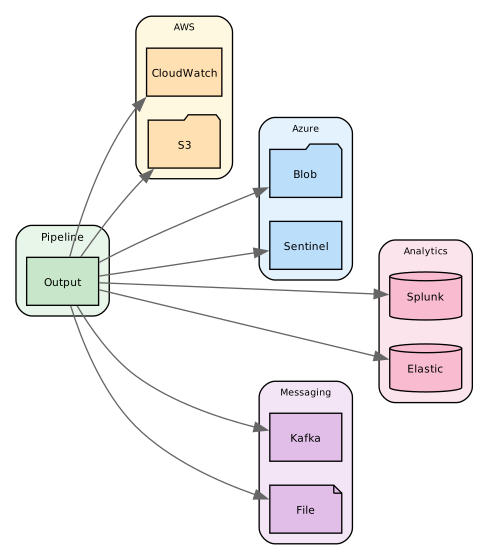
Targets provide flexible options for data persistence and integration with various analysis platforms.
Definitions
Targets serve as the endpoint destinations for processed data within the Director system. They operate on the following principles:
- Output Configuration: Targets define where and how data should be delivered after processing.
- Format Adaptation: They handle the conversion of internal data structures to destination-specific formats.
- Delivery Management: Targets manage connection pooling, batching, and retry mechanisms.
- Destination Integration: They provide authentication and protocol-specific features for various systems.
Targets enable:
Persistence: Local and remote storage with various retention options.
Integration: Seamless connection to analytics platforms and messaging systems.
They also support data transformation, and delivery confirmation.
Target Architecture
DataStream uses a small number of target implementations that each support multiple integrations (services). This efficiency pattern means similar services share implementation code:
| Implementation | Integrations Supported |
|---|---|
| awss3Target | Amazon S3, Security Lake, Cloudflare R2, MinIO, DigitalOcean Spaces, and 6 others |
| kafkaTarget | Apache Kafka, Confluent Cloud, Aiven Kafka, Redpanda, WarpStream, Amazon MSK, IBM Event Streams |
| elasticTarget | Elasticsearch, Amazon OpenSearch, Elastic Security |
| splunkTarget | Splunk, Splunk Enterprise Security, CrowdStrike Falcon Next-Gen SIEM |
| syslogSIEMTarget | ArcSight, OpenText, Trellix, Snare, Logpoint (CEF/JSON over syslog) |
| gelfTarget | Graylog, OVHcloud (GELF) |
| siemHTTPTarget | Datadog, Sumo Logic, Rapid7 (JSON over HTTPS) |
Each integration gets its own documentation chapter with platform-specific details, even when the underlying implementation is shared.
Postprocessing Pipelines
Targets can have pipelines attached for output format transformation via the pipelines field. These postprocessing pipelines convert standardized pipeline output to target-specific formats before delivery.
Common postprocessing tasks include:
- Field mapping to destination schemas (ECS, CIM, ASIM)
- Format conversion for target requirements
- Data filtering before delivery
Configuration
All targets share the following base configuration fields:
| Field | Required | Default | Description |
|---|---|---|---|
name | Y | Unique identifier for the target | |
description | N | Optional explanation | |
type | Y | Target type | |
status | N | true | Enable/disable the target |
batch_size | N | 1000 | Records per batch |
Each target type provides specific configuration options detailed in their respective sections.
Use the name of the target to refer to it in your configurations.
Example:
targets:
  - name: elasticsearch
    type: elastic
    properties:
      hosts: ["http://elasticsearch:9200"]
      index: "logs-%{+yyyy.MM.dd}"
      username: "elastic"
      password: "${PASSWORD}"
The target listed here is of type elasticsearch. It specifies the host that it will forward the data to and the index on the host to which the data will be appended. To access the host, it specifies a username and a password.
You can use environment variables like ${PASSWORD} for your credentials. This will improve security by removing the credentials from your configuration file.
Target Types
The supported types are grouped by platform and destination family - cloud services, message queues, analytics platforms, SIEMs, object storage, and local output. See Targets: Catalog for the complete list.
Three groups carry a caveat that decides how a pipeline must be written for them:
- Analytics: the Databricks and Snowflake targets are staging-based. They write files to object storage first, then issue a load command, so a bucket or container is part of their configuration rather than an alternative to it.
- SIEM: most are transport-only. The event is expected to already be in the platform's wire format when it reaches the target, which handles framing and delivery only - format conversion is a pipeline concern.
- Cloud Storage: all are S3-compatible and share the Amazon S3 implementation, so they take the same file formats, rotation, and multipart upload behavior, differing only in endpoint and credentials.
Scheduling and Pool Behavior
Every target runs in a dedicated worker pool. Scheduling and parallelism fields apply uniformly to every target type and live directly inside the target's properties: block:
targets:
  - name: my_target
    type: <any-target-type>
    properties:
      # ... target-specific fields ...
      interval: 300                 # flush every 5 minutes
      cron: "0 20 * * *"            # OR flush nightly at 20:00 (cron wins if both set)
      max_items: 50000              # force an early flush after N queued notifications
      queue:
        parallelism: 1              # worker count override (optional)
| Field | Required | Default | Description |
|---|---|---|---|
interval | N | -* | Flush every N seconds (fixed cadence). Accepts an integer count of seconds or a duration string (30s, 5m, 2h, 1d) |
cron | N | - | Flush per cron expression (e.g. 0 20 * * * = every day at 20:00) |
max_items | N | 50000 | Force an early flush once N notifications have accumulated. 0 means unbounded |
queue.parallelism | N | service workers value | Number of pinned worker goroutines for this target |
queue.interval | N | - | Legacy fallback location for interval (nested under queue:) |
queue.cron | N | - | Legacy fallback location for cron (nested under queue:) |
queue.max_items | N | - | Legacy fallback location for max_items (nested under queue:) |
* = Three target types supply their own default when neither interval nor cron is set — see Target types that default to a flush interval.
Mode selection
interval set? | cron set? | Resulting mode |
|---|---|---|
| No | No | Immediate — flush once per incoming notification, except for the three types below |
| Yes | No | Scheduled (interval) — accumulate, flush every N seconds |
| No | Yes | Scheduled (cron) — accumulate, flush per cron expression |
| Yes | Yes | Scheduled (cron) — cron wins; interval is ignored |
In scheduled mode the pool calls the target's Send for every event but defers Finalize until the schedule fires. This produces "one batch per tick" semantics — important for file-like targets (file, awss3, azblob, gcpstorage, gcpsecops) where each tick produces a single output file.
max_items does not select a mode. It only forces an early flush inside whichever scheduled mode is already in effect, and has no effect in immediate mode.
Target types that default to a flush interval
Three target types supply their own flush cadence when neither interval nor cron is configured, in either the top-level or the legacy queue: form:
| Target type | Documentation page |
|---|---|
sentinel | Microsoft Sentinel |
azmon | Azure Monitor |
sentineldatalake | Microsoft Sentinel data lake |
Left unconfigured, these flush every 30 seconds rather than once per notification. Every other target type still defaults to immediate mode.
Immediate mode caps a batch at a single ingester rotation slot — a few KB against the megabyte-class upload buffer these targets use — so a director spends roughly 100x the API round-trips its egress needs. If ingest outruns delivery the payload store grows until the router stage quota fills, at which point routing blocks and ingestion stops.
The Director log names the source of the cadence when a target chose it rather than the operator:
Sender target pool "my-sentinel" created (type: sentinel, max: 4, pinned: 4, flush: 30s (target default))
Set interval or cron explicitly to choose a different cadence.
Opting out, and the legacy queue: form
Setting interval: 0 selects immediate mode explicitly. On the three types above this is honored but logged as a warning, because it reinstates the delivery stall the default exists to prevent.
interval, cron and max_items are each read from the top-level key first and from the legacy queue: block second. A top-level key wins only when it carries a positive value, which makes one combination read against expectation:
| Configuration | Result |
|---|---|
interval: 0 alone | Immediate mode |
queue.interval: 0 alone | Immediate mode |
interval: 0 and queue.interval: 30 | Scheduled at 30s from the legacy key — not immediate mode, and no warning |
Do not mix the two forms on one target. Prefer the top-level keys; queue.{interval,cron,max_items} exists for older hand-written configurations.
A value the parser cannot read — interval: "later", or a binary-unit typo — resolves to 0 and therefore selects immediate mode, with a warning. A negative interval is indistinguishable from an absent key and silently takes the default instead. Check the Director log after changing a schedule.
Parallelism
File-like targets force queue.parallelism: 1 regardless of the configured value — concurrent writers cannot produce a single coherent file per tick. Network and analytics targets default to the service-level workers setting (minimum 2 when unspecified).
Bad cron expressions
A cron value that cannot be parsed causes the target pool to fail at startup. Validate cron syntax with a fixture run before promoting to production.
Rate Limiting
Optional per-target throttling caps how fast and how much data a target accepts. Configure it with a limit block. Both caps are disabled by default, and throttling is independent of batch_size and worker parallelism.
| Field | Type | Default | Description |
|---|---|---|---|
eps | numeric | 0 (unlimited) | Maximum events per second. |
daily_gb | numeric | 0 (unlimited) | Maximum data volume per day, in GiB. The counter resets at midnight (local time). |
behaviour | string | delay | Action when a cap is reached: delay or drop. |
behaviour controls how overflow is handled:
delay— events are paced to stay withineps; oncedaily_gbis reached, delivery is held and retried until the daily counter resets at midnight. No data is discarded.drop— events beyondeps(within a one-second window) or arriving afterdaily_gbis reached are discarded silently.
An unknown or empty behaviour falls back to delay, so a misconfiguration preserves data rather than dropping it.
targets:
  - name: my_target
    type: ...
    limit:
      eps: 5000
      daily_gb: 50
      behaviour: delay
Editing a target's limit recreates its worker pool, which resets the daily byte counter. A negative daily_gb is rejected and the target will not start.
Targets support debug configuration options for testing, troubleshooting, and development purposes. These options allow you to inspect data flow without affecting production systems.
Configuration
Debug options are configured under the debug property within target properties:
targets:
  - name: test_elastic
    type: elastic
    properties:
      index: "test-logs"
      endpoints:
        - endpoint: "http://elasticsearch:9200"
      debug:
        status: true
        dont_send_logs: false
Debug Fields
| Field | Required | Default | Description |
|---|---|---|---|
debug.status | N | false | Enable debug logging for the target |
debug.dont_send_logs | N | false | Prevent logs from being sent to the actual target |
Debug Status
When debug.status is set to true, the target logs each event to the internal debugger before processing. This provides visibility into:
- Message content being sent
- Device information (ID, name, type)
- Target type and operation details
- Timing and sequence of events
Debug logs are written to the system's debug output and can be used to:
- Verify data transformation and formatting
- Troubleshoot pipeline processing issues
- Monitor data flow in development environments
- Audit message content during testing
Don't Send Logs
When debug.dont_send_logs is set to true, events are logged to the debugger but not sent to the actual target destination. This is useful for:
- Safe Testing: Test configuration changes without affecting production systems
- Development: Develop and validate pipelines without external dependencies
- Cost Control: Avoid charges from cloud services during testing
- Dry Runs: Verify event formatting and routing logic before deployment
The dont_send_logs option only works when debug.status is also set to true. If debugging is disabled, logs will be sent normally regardless of the dont_send_logs setting.
Use Cases
Development Environment
Test your configuration safely without sending data to production targets:
targets:
  - name: dev_splunk
    type: splunk
    properties:
      endpoints:
        - endpoint: "https://splunk.example.com:8088/services/collector"
          token: "YOUR-TOKEN"
      index: "main"
      debug:
        status: true
        dont_send_logs: true
Troubleshooting
Enable debug logging to diagnose issues while still sending data:
targets:
  - name: debug_elastic
    type: elastic
    properties:
      index: "production-logs"
      endpoints:
        - endpoint: "http://elasticsearch:9200"
      debug:
        status: true
        dont_send_logs: false
Pipeline Validation
Verify pipeline transformations before enabling the target:
targets:
  - name: validate_transformations
    type: splunk
    properties:
      endpoints:
        - endpoint: "https://splunk.example.com:8088/services/collector"
          token: "YOUR-TOKEN"
      field_format: "cim"
      debug:
        status: true
        dont_send_logs: true
    pipelines:
      - name: test_pipeline
        processors:
          - set:
              field: environment
              value: "development"
Staged Deployment
Test new target configurations in parallel with existing ones:
targets:
  # Production target (normal operation)
  - name: prod_elastic
    type: elastic
    properties:
      index: "production-logs"
      endpoints:
        - endpoint: "http://prod-elasticsearch:9200"

  # Test target (debug mode, no actual sending)
  - name: test_elastic
    type: elastic
    properties:
      index: "test-logs"
      endpoints:
        - endpoint: "http://test-elasticsearch:9200"
      debug:
        status: true
        dont_send_logs: true
Deployment
The following deployment types can be used:
-
One-to-many - data from a single source is routed to one or more destinations:
Syslog → Local Storage + Analysis Platform
-
Many-to-one - data from multiple sources is routed to one destination:
Syslog + Windows → Local Storage
-
Many-to-many - data from multiple sources is routed to multiple destinations:
Syslog + Windows → Local Storage
Syslog + Elasticsearch → Cloud Upload + Analysis Platform
-
Chained - data is routed sequentially from one destination to the next:
Syslog → Local Storage → Analysis Platform
Multiple targets can be used for redundancy, normalization rules can be implemented, and alerts can be put in place for notification and error handling.
Use Cases
The most common uses of targets are:
-
Local analysis - Debug logging, performance analysis, audit trails, and temporary storage.
-
Cloud integration - Long-term storage, data warehousing, security analysis, and compliance monitoring.
-
Real-time analysis - Live monitoring, alert generation, trend analysis, and performance tracking.
-
Data lake building - Raw data storage, schema evolution, data partitioning, and analytics preparation.
To serve these ends, the following processing options are available:
-
Pipelines - Field normalization (for ECS, CIM, ASIM, CEF, LEEF, and CSL), data transformation, message batching, custom field mapping, schema validation, and format conversion.
-
Buffer management - Configurable buffer sizes, batch processing, flush intervals, queue management, checkpoint recovery, and error handling.
-
Performance - Asynchronous writing, buffer optimization, connection pooling, retry mechanisms, resource monitoring, and size-based rotation.
-
Security - Authentication using API keys, service principals, and client certificates. Encryption with TLS/SSL, HTTPS, or custom algorithms. Also, access control and audit logging.
Implementation Strategies
The following strategies configure target output and storage options.
Output Form Factors
Independently of which service a target writes to, its output takes one of three shapes. This determines what you configure for buffering, rotation, and delivery. See Target Types above for the full list of destinations.
-
Streamed — each event, or a batch of events, is sent over a live connection as it arrives. Network and messaging targets work this way. Configuration centers on batching, connection reuse, and retries.
-
File-based — events accumulate into files that are closed and shipped on a size or time boundary. Local files and every object-storage target work this way. Configuration centers on format, compression, and rotation.
-
Staged — files are written to object storage first, then a load command ingests them into the destination. The Redshift, Databricks, and Snowflake targets work this way, so they need both the staging bucket's configuration and the warehouse's.
File Formats
The file-based and staged form factors write one of the following:
json— each log entry is written as a separate JSON line (JSONL format)multijson— all log entries are written as a single JSON arrayavro— Apache Avro format with schemaparquet— Apache Parquet columnar format with schema
Compression options like ZSTD, GZIP, Snappy, Brotli, and LZ4 are also supported. Additional features include dynamic file naming, size-based rotation, buffer management, and schema validation.
- Microsoft Sentinel - Direct DCR integration and ASIM normalization are supported. In addition to standard tables, WindowsEvent, SecurityEvent, CommonSecurityLog, and Syslog can be used. Various ASIM tables are also available. (See the ASIM section for a complete list.)